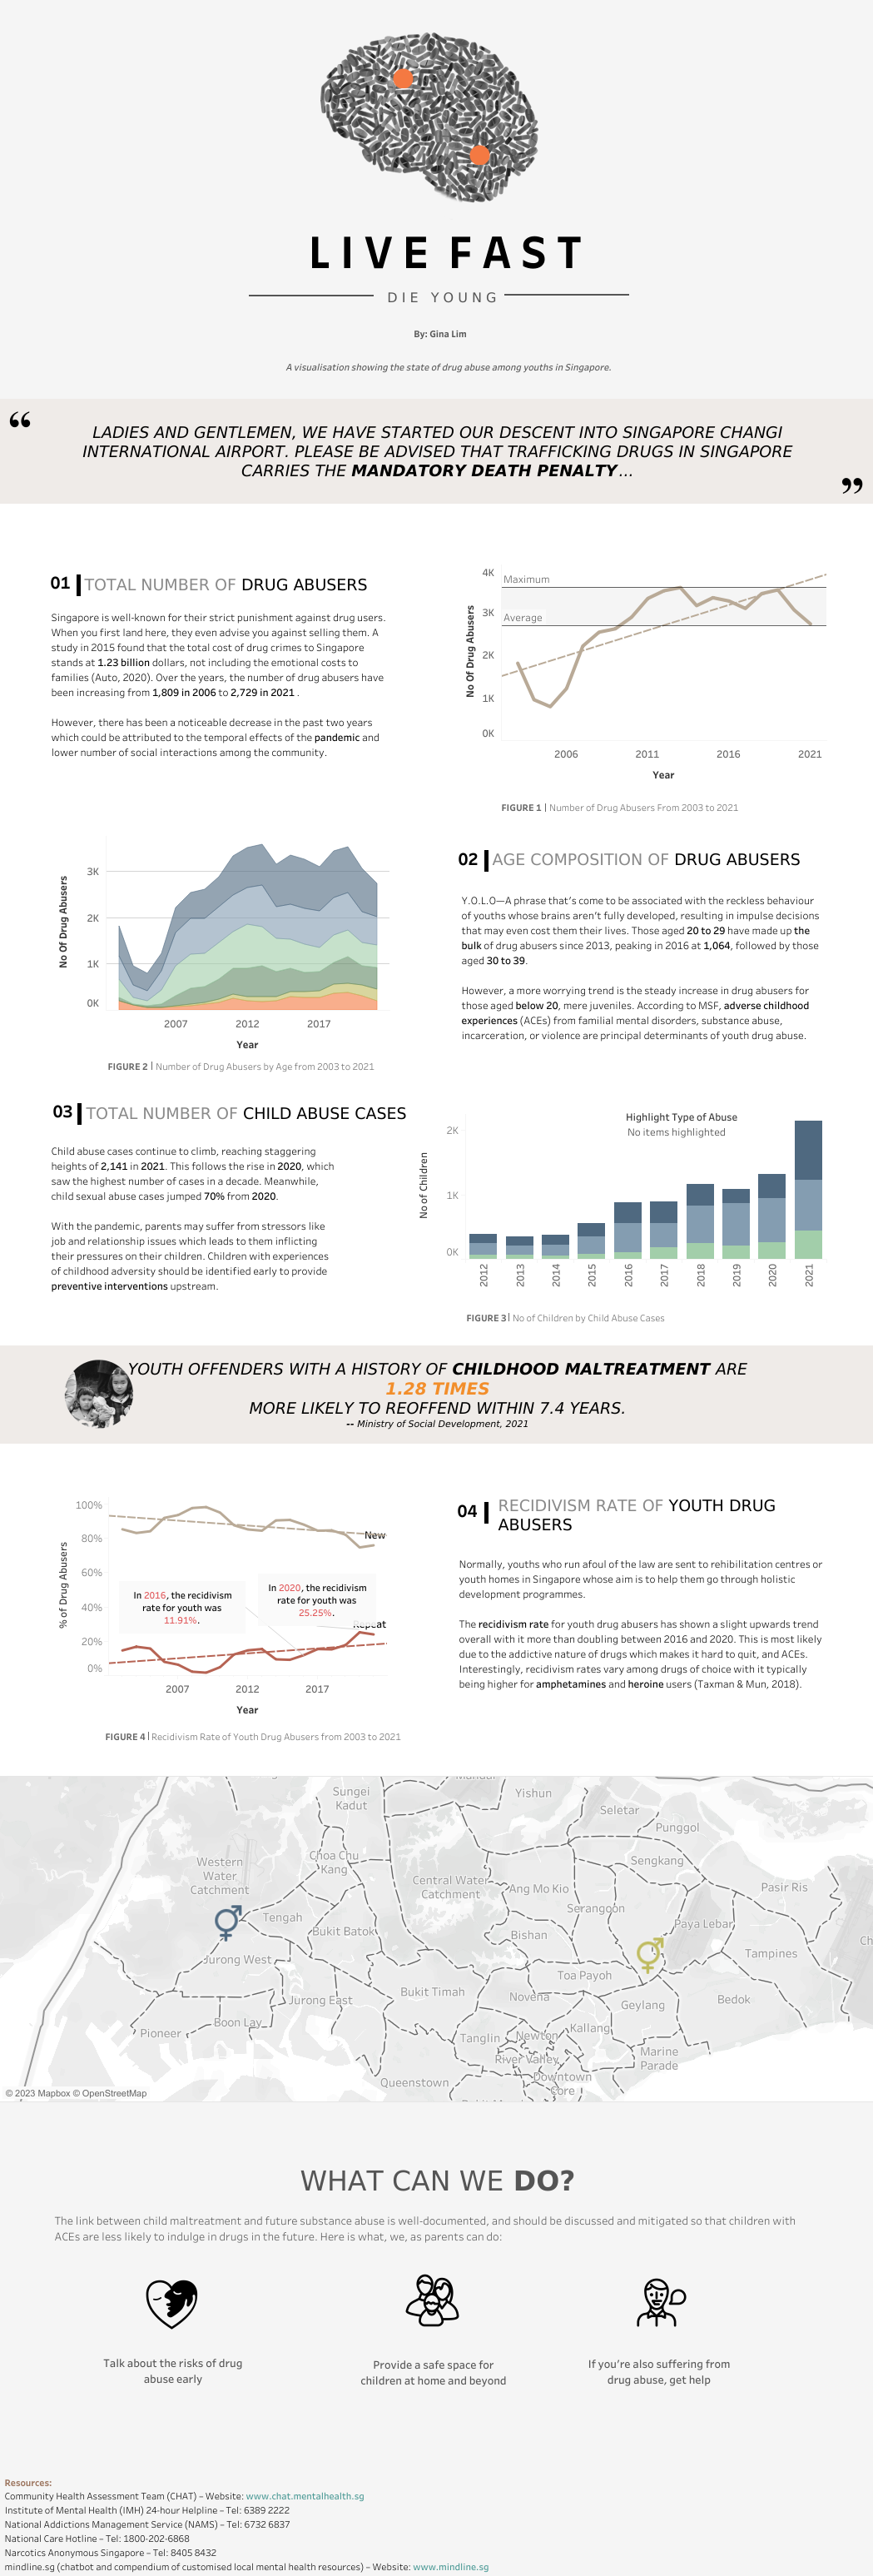
Visualising drug abuse in singapore 💊
This data visualisation was done as an assignment for the course ‘Data Visualisation’ at SIT. The visualisation shows the rate of drug abuse across all age groups and its relationship to adverse childhood experiences. Sources were from Data.gov, SingStat and Ministry of Social and Family Development.
Final Design

The final design of the data visualisation. View in high-resolution.
I chose a poster as a graphical representation of the data as the combination of text, charts, and images guides the viewer's eye and encourages them to scroll down. I also chose a calm colour palette to offset the serious nature of the topic.
Process
In representing the data from "The Report on Youth Delinquency 2021" by the Ministry of Social and Family Development, the poster was designed to showcase the data in a flow from top to bottom, starting with identification of trends, then delving into the relationship between different issues, and finally, highlighting the resources available to combat these issues.
The datasets used in the poster were retrieved from three different websites and merged into one for analysis. The story flow was deduced from the analysis of the data. It was a process that involved a lot of data manipulation to figure out hidden insights. The final poster makes it easy for the viewer to understand the data and its significance.
Check out my Tableau Public profile.